TMS FNC Chart 1.0.0.1 Details
Shareware 8.49 MB
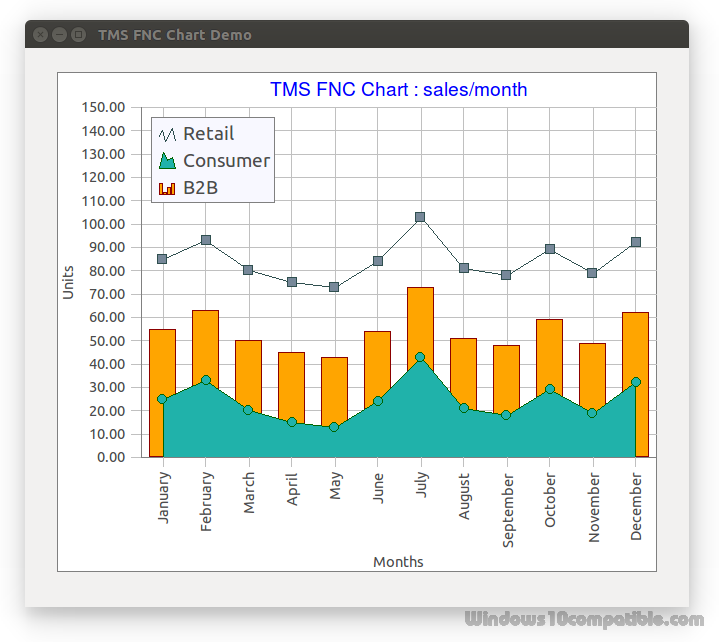
Fully cross-platform chart component designed for business, statistical, financial & scientific data.
Publisher Description
 - Highly configurable cross-platform chart.
- Support for VCL Win32/Win64, FMX Win32/Win64, MacOS-X, iOS, Android, LCL Win32/Win64, Mac OS-X, iOS, Android, numerous Linux variants including Raspbian
- Support for multiple series with optional separate or combined auto range for x- and y-axis.
- Bar, grouped bar, absolute stacked bar, percentage stacked bar, area, stacked area chart types.
- Pie, donut, spider, line and digital line chart types.
- XY line and XY scatter chart types.
- Legend with glyph representing the chart type for each series.
- Formatting of values in various formatting types (numbers, floating point numbers and date time)
- X-axis and y-axis with optional custom formatting for each series and multiple position support.
- Optional configurable background grid.
- Series markers with bitmap and custom drawing support.
- Series labels with formatting support and optional stacked mode.
- Annotations for each series point.
- Optional 3D drawing mode.
- Design time editor.
- Separate runtime editor for desktop operating systems.
- High number of events for further customization.
- Opacity support (FMX only)
- Highly configurable cross-platform chart.
- Support for VCL Win32/Win64, FMX Win32/Win64, MacOS-X, iOS, Android, LCL Win32/Win64, Mac OS-X, iOS, Android, numerous Linux variants including Raspbian
- Support for multiple series with optional separate or combined auto range for x- and y-axis.
- Bar, grouped bar, absolute stacked bar, percentage stacked bar, area, stacked area chart types.
- Pie, donut, spider, line and digital line chart types.
- XY line and XY scatter chart types.
- Legend with glyph representing the chart type for each series.
- Formatting of values in various formatting types (numbers, floating point numbers and date time)
- X-axis and y-axis with optional custom formatting for each series and multiple position support.
- Optional configurable background grid.
- Series markers with bitmap and custom drawing support.
- Series labels with formatting support and optional stacked mode.
- Annotations for each series point.
- Optional 3D drawing mode.
- Design time editor.
- Separate runtime editor for desktop operating systems.
- High number of events for further customization.
- Opacity support (FMX only)
Download and use it now: TMS FNC Chart
Related Programs
NOV Chart for .NET
NOV Chart for .NET is an advanced charting control for .NET, covering a vast feature set of charting types for presentational, business, scientific, financial, real-time monitoring, statistical and other types of applications. NOV Chart for .NET enables developers to create...
- Shareware
- 21 Aug 2016
- 307.34 MB
Gantt Chart
The Gantt Chart is a modern and extremely easy-in-use project plan system. This system allows you to specify complex tasks sequences - a task or multiple tasks can be required to be completed before other tasks can be started. This...
- Shareware
- 01 May 2017
- 13.87 MB
Nevron Chart for .NET
Nevron Chart for .NET is designed to be flexible, efficient and extensible. Combining a vast amount of features in an intuitive and straightforward programming model, the component can display virtually any 2D or 3D chart including: Bar, Line, Step Line,...
- Shareware
- 20 Jul 2015
- 226.61 MB
Nevron Chart for SSRS
Nevron Chart for SQL Server Reporting Services (SSRS) is an advanced report item, delivering a complete set of 2D and 3D charting types, highly customizable axes, tight data integration and unmatched visual effects to your reports. It instantly improves your...
- Shareware
- 20 Jul 2015
- 68.98 MB
Nevron Chart for SharePoint
Based on the latest versions of Nevron's Charting Engine for ASP.NET and the new Nevron Pivot Data Aggregation Engine, Nevron Chart for SharePoint is optimized for SharePoint (WSS and MOSS), providing advanced charting functionality and a wide range of features...
- Shareware
- 20 Jul 2015
- 53.12 MB